Network simulator and Satellite Network Simulation.
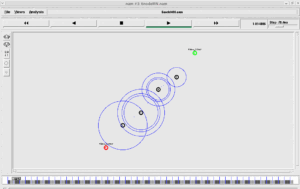
NS-2 offers the simulation of different kinds of networks, modelling of different types of nodes, links, protocols, traffics and mobilities. Ns2 can be used for exact satellite network simulation with detailed modelling of radiofrequency characteristics such as interference, fading, protocol interactions such as interactions of residual burst errors on the link with error checking codes, and second-order orbital effects like precession, gravitational anomalies, etc.
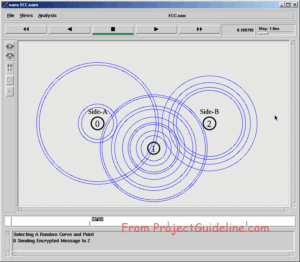
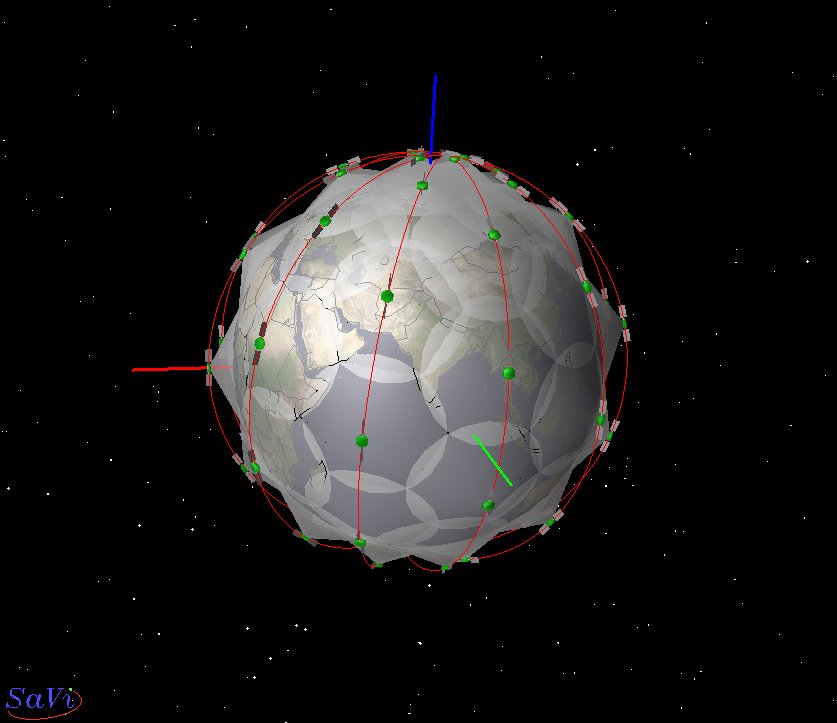
The default Network visualization tool of ns2 – the Network Animator (NAM) will not support satellite network visualization. But there are open source software Sat-plot-scripts(Perl scripts), Savi and Geomview which can be used to visualize satellite constellations.
Sat-plot-scripts[1]
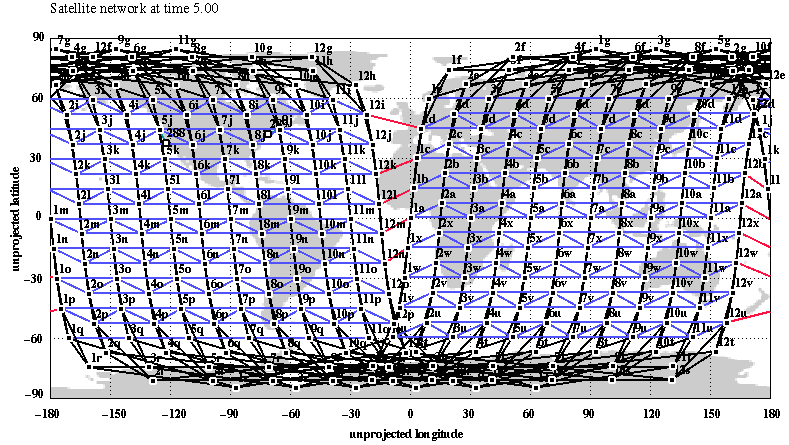
Sat-plot-scripts allow you to draw topologies of satellite constellation networks with inter-satellite links and paths taken by traffic on unprojected or polar azimuthal equidistant maps of the Earth. These Perl scripts can be used to visualize ns satellite constellation configurations, both an overall snapshot of the satellite positions at a given time and the path that a packet takes through the network. Original scripts were written by Tom Henderson, Daedalus Group, the University of California at Berkeley. Enhanced (functionality, switches, map options, polar plots) by Lloyd Wood, Centre for Communication Systems Research, University of Surrey.
Software for the visualization and analysis of satellite constellations – Savi[2]
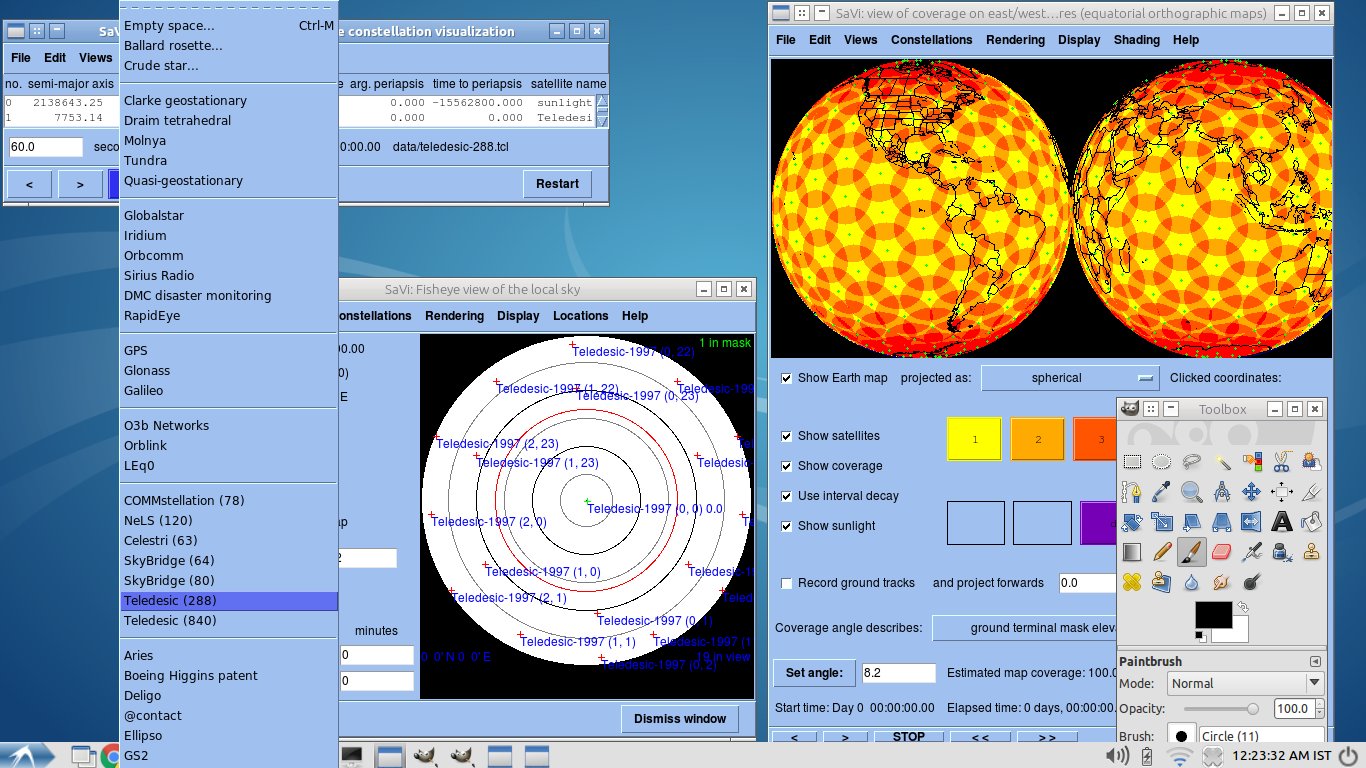
Software for the visualization and analysis of satellite constellations(SaVi) is software written to facilitate the visualization and analysis of satellite constellations. This software is freely and publicly available. We require that use of any images produced by this software credits SaVi and The Geometry Center. It has a graphical user interface which includes the following features: 1)Three-dimensional visualization of satellites in orbit around the Earth, 2)Display of satellites’ footprints on the Earth’s surface and computation of the fraction of the Earth’s surface covered by the constellation, and 3)Simulation of a view of the satellites overhead from an arbitrary point on the Earth’s surface. Created at the Geometry Center at the University of Minnesota.
Geomview[3]
Geomview is an interactive 3D viewing program for Unix. Geomview lets you view and manipulate three-dimensional objects: you use the mouse to rotate, translate, zoom in and out, and so on. Geomview can be used as a standalone viewer for static objects or as a display engine for other programs which produce dynamically changing geometry. Geomview can display objects described in a variety of file formats. Geomview comes with a wide selection of example objects, and you can create your own objects too.
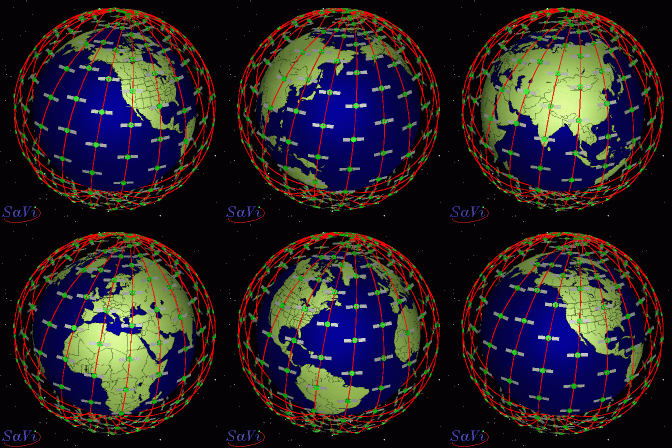
SaVi can optionally use Geomview for the 3D rendering of Earth and satellites. Geomview requires a Unix-like operating system and
an X Window display. SaVi can be run either as a stand-alone program or as an “external module” for the Geomview program. The latter mode enables three-dimensional visualization of the satellite constellations but also needs the Geomview program.
Related Articles
ns-3 has excellent support for simulation satellite networks. Check the following articles to know about it :
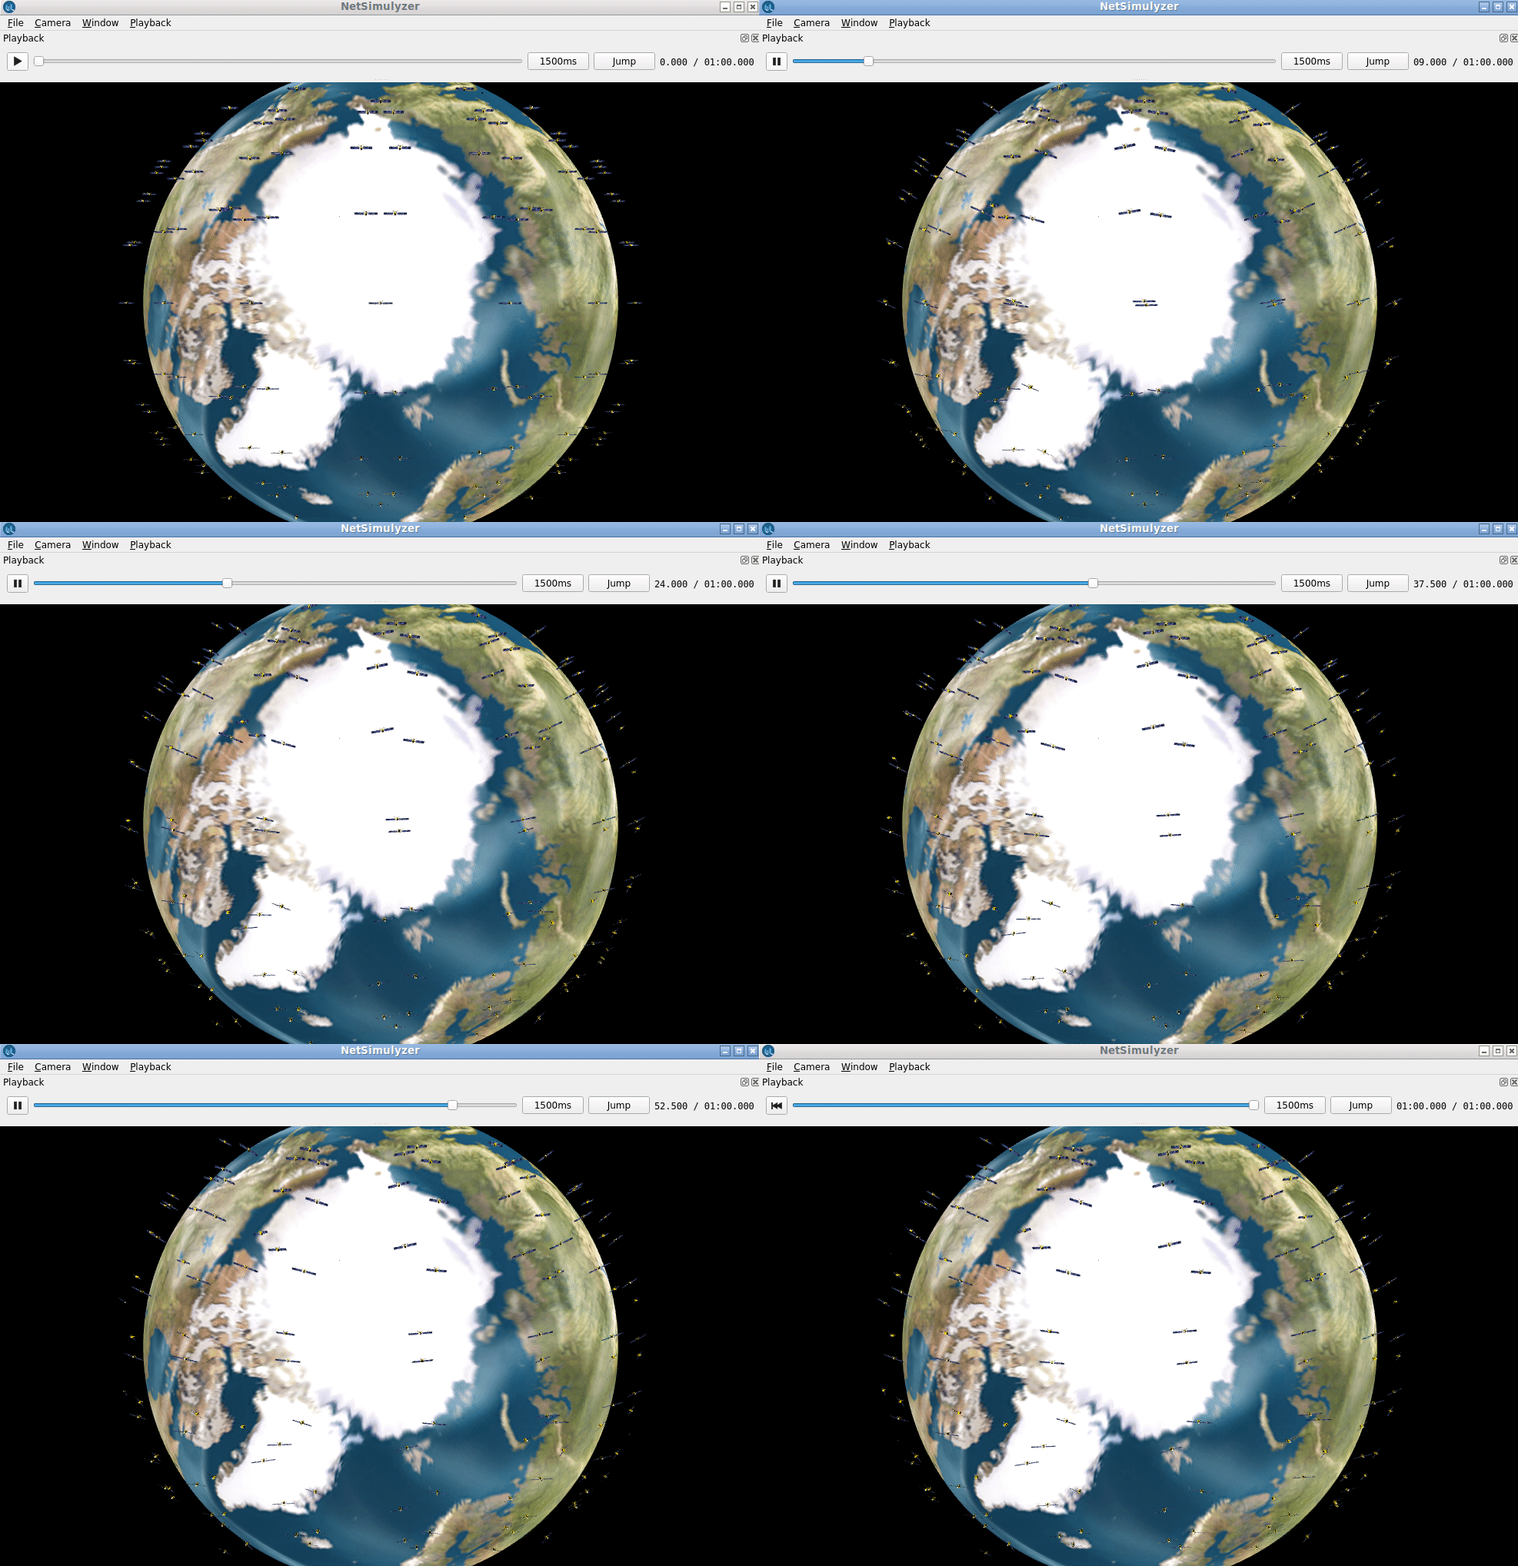
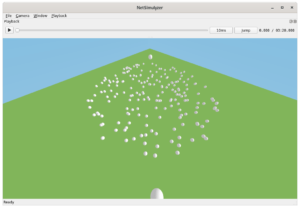
Visualizing ns-3 LEO Satellite Network using NetSimulyzer 3D
We may do more realistic satellite network simulation using OmNet ++ with realistic visualization as shown below:
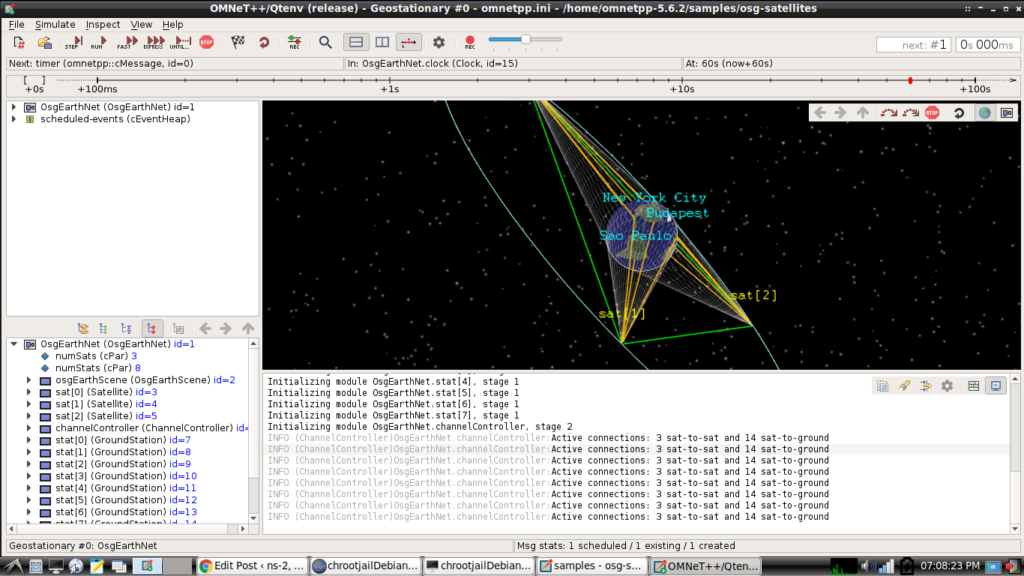
The following article explains the procedure for installing OmNet++ :
https://www.projectguideline.com/installing-omnet-in-debian-9-chroot-jail-under-debian-11-host-os/
Installing Omnet++ in Debian 9 chroot Jail Under Debian 11 Host OS
References

 Discuss Through WhatsApp